- From: Renoir Boulanger <renoir@w3.org>
- Date: Mon, 05 May 2014 12:10:00 -0400
- To: List WebPlatform public <public-webplatform@w3.org>
- Message-ID: <5367B7D8.1090504@w3.org>
Hi all,

When I started my day today, I realized how strange our caching was
acting up. While the site was still running without problems for most of
it, the memory usage was a bit higher than usual.

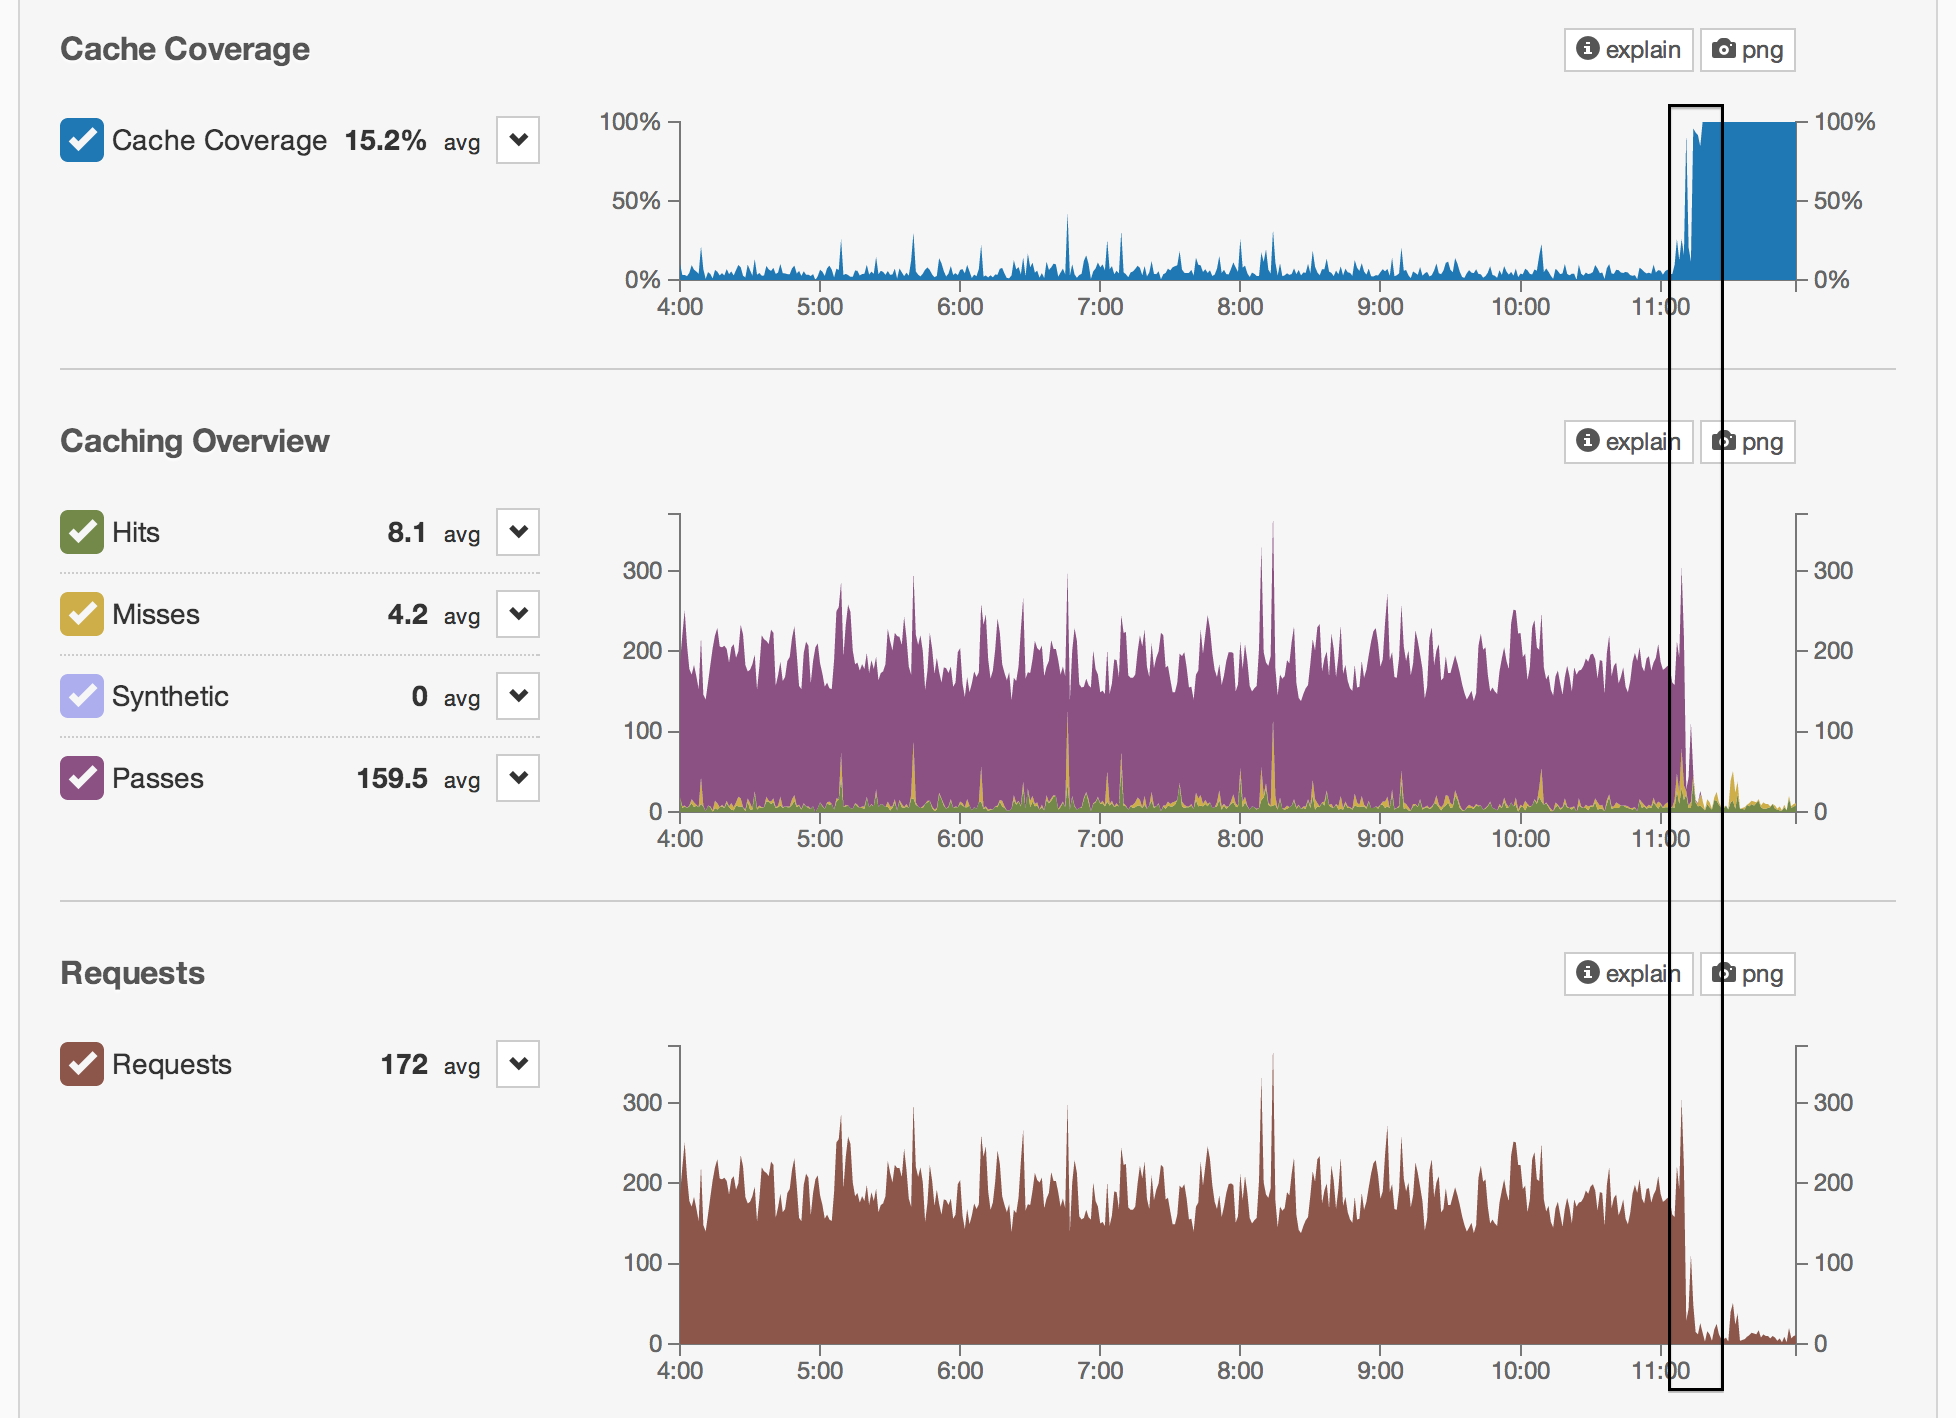
After some digging, I realized that most of the requests weren't cached
and the logs were flooded with POST /wp-cron.php (see attachment). You
can see the Fastly caching graph at the rectangle, this is when I made
the change. After the change, you will see that the cache RATE jumped to
100% and the passes and requests dropped.

After some reading, I realized that its either that somebody is creating
a problem by constantly hitting our /wp-cron.php file(an attacker?), or
the caching layer checks too enthusiastically. A sure thing is that I do
not remember seeing that much requests, it would had jumped at me earlier.

In any case, the wp-cron.php will not be called from the outside anymore
but managed by our very own crontab. Problem solved.

--
Regards,

Renoir Boulanger  |  Developer operations engineer
W3C  |  Web Platform Project

http://w3.org/people/#renoirb  ✪  https://renoirboulanger.com/  ✪  @renoirb
~
Attachments
- image/png attachment: wp-cron-dos.png

Received on Monday, 5 May 2014 16:10:09 UTC