- From: Ivan VAGANOV <ivan_vaganov@mail.ru>
- Date: Fri, 5 Sep 2014 20:09:38 +0100
- To: <public-swisig@w3.org>
- Message-ID: <000301cfc93c$f13f6c40$d3be44c0$@ru>
Dear Community!

I would like to ask for your professional advice, since you have much more
experience in the topic than me.


IN SHORT:

I am searching for a simple tool with graphic interface which would allow me
to structure and visualize knowledge for my master thesis. I am willing to
link a few blocks with simplest RDF links, so I will be able to present
pictures/graphs and allow the examinators to browse through by their own. I
would like to use the approach of semantic web and not to describe the
issues in plain text. I am writing about information extraction and text
mining.


FEW MORE DETAILS:

After reviewing literature, I have a big table. In fact, it has a few types
of elements:

.       Source

.       Name of a program,

.       Type of Interface,

.       Purpose

.       Details.


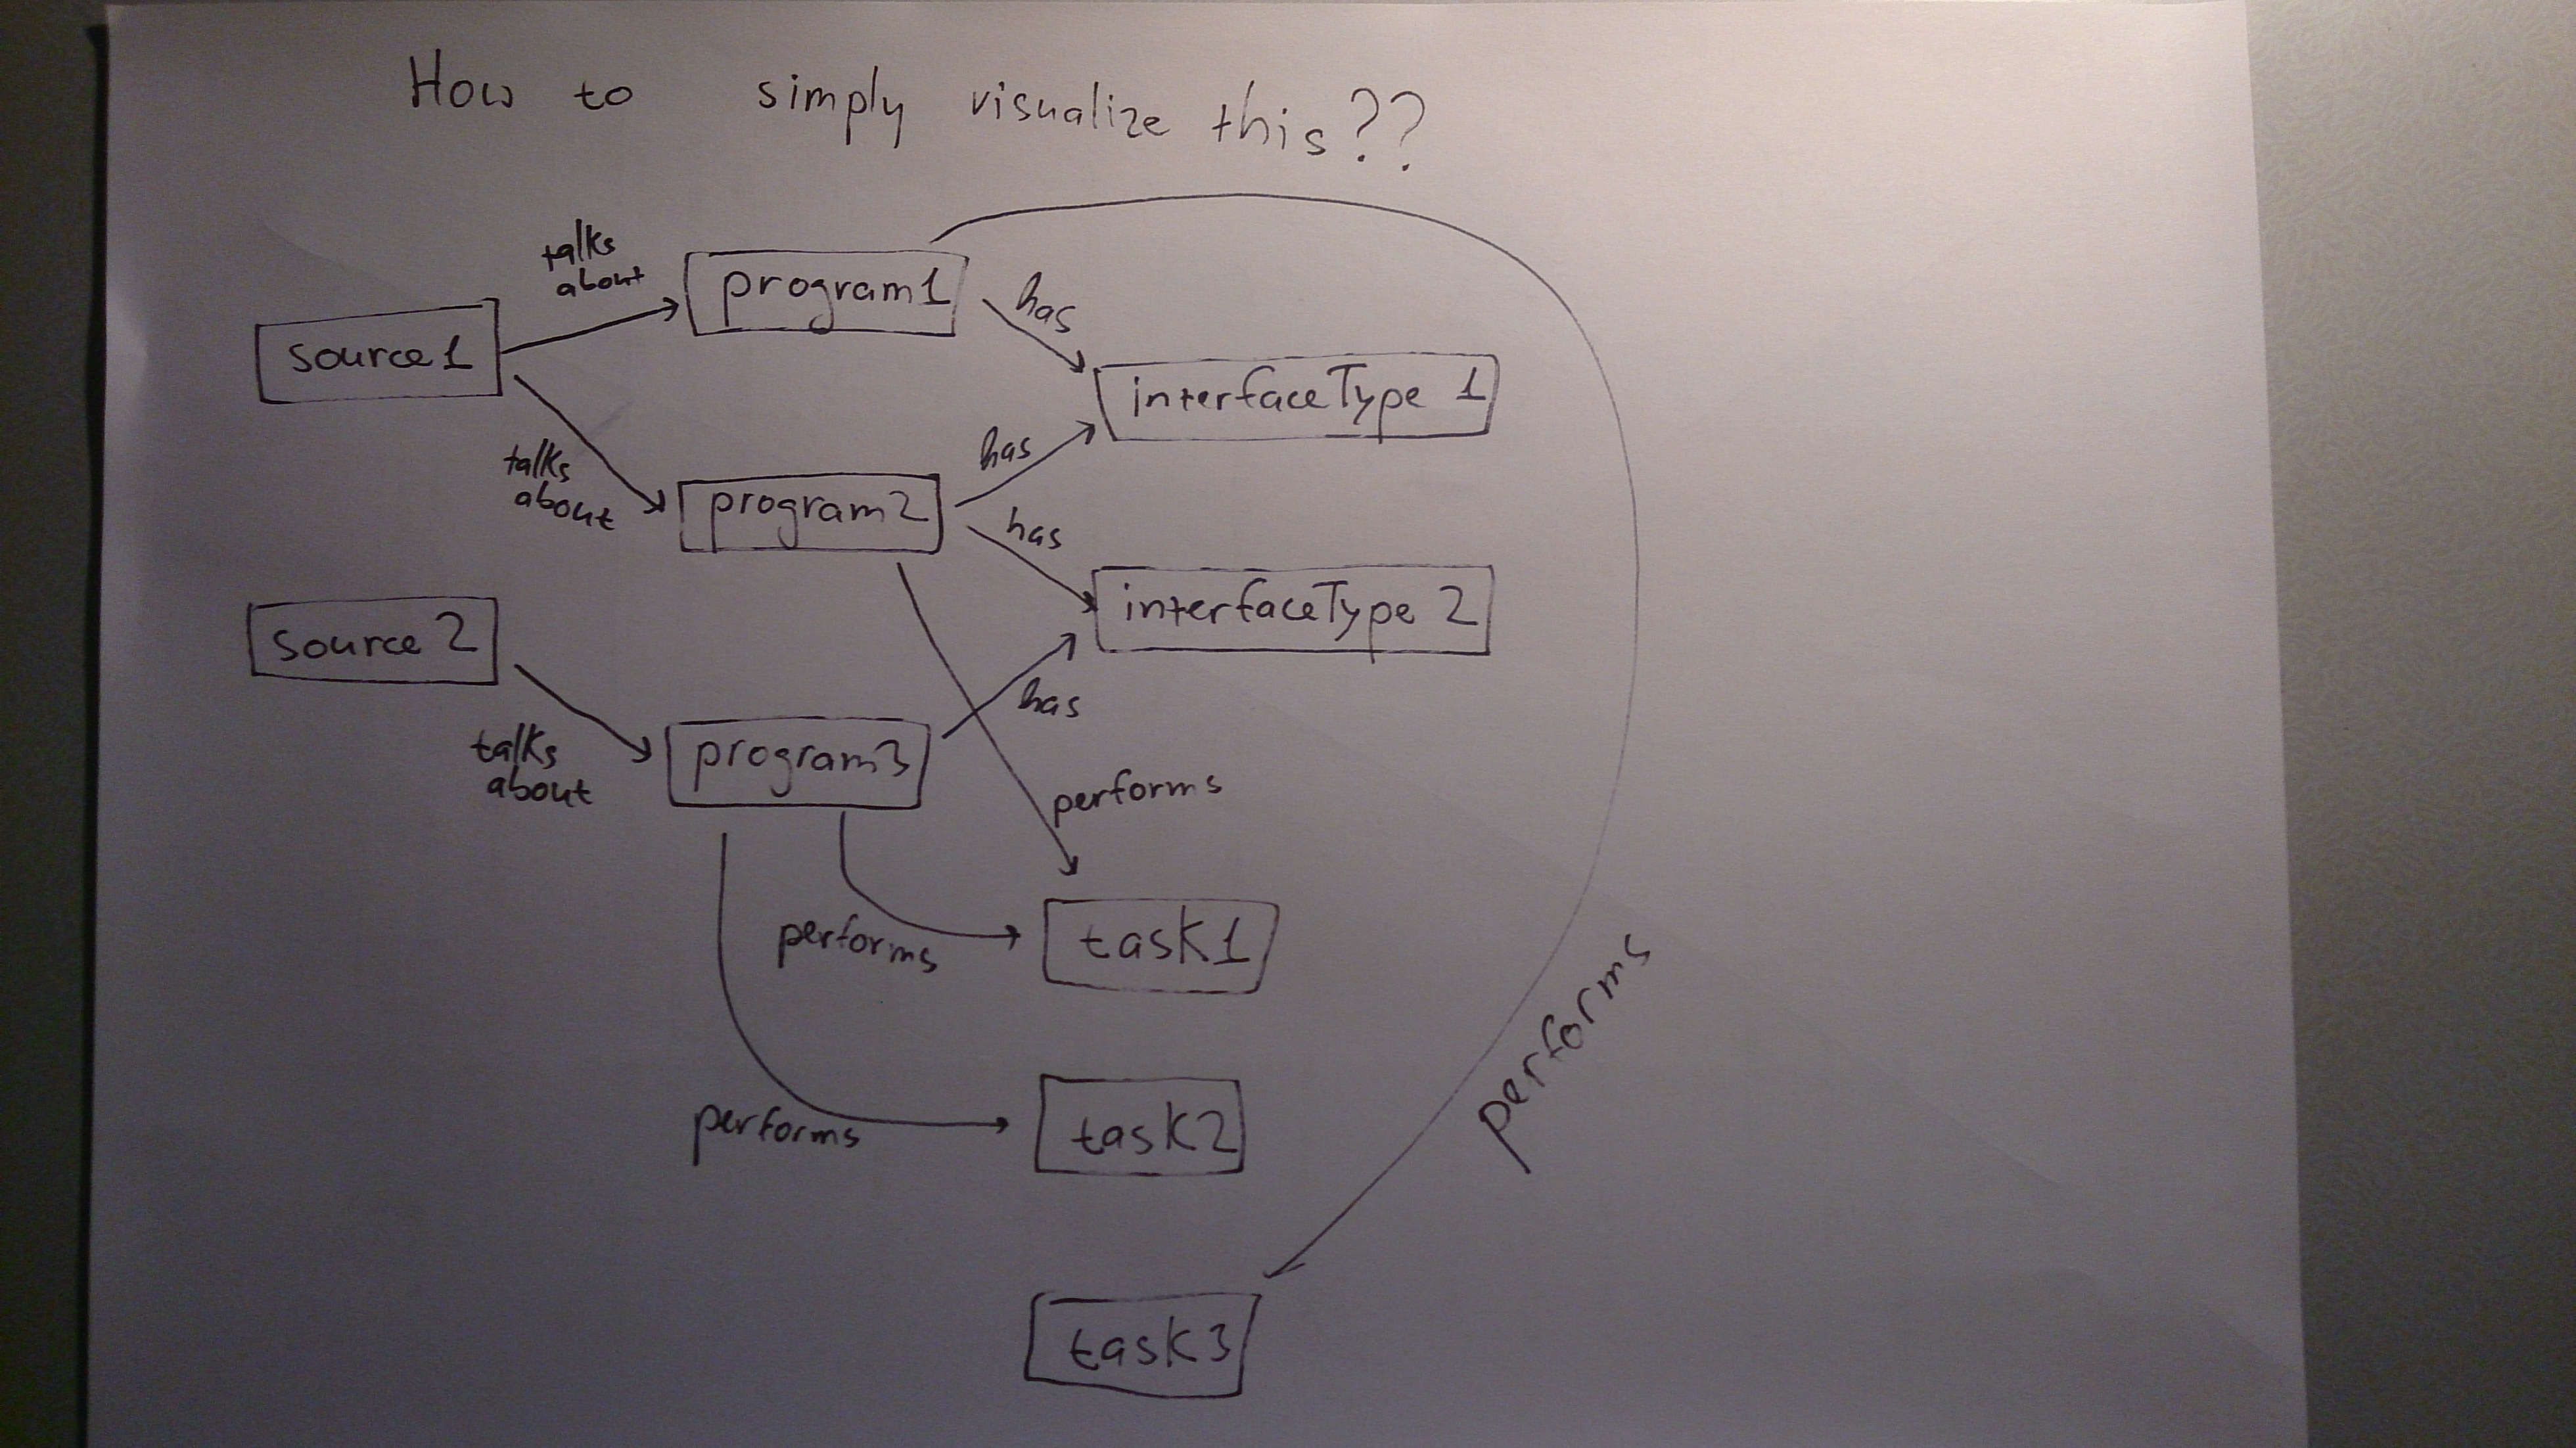
All that information is interlinked - one source talks about few programs,
different programs have same type of interface, different programs have same
purpose, or one program have a few purposes.

I would like to connect these blocks and visualize it, to have something as
on attached picture. In the best case, each block should have a link to an
excel file (or URL) with all the details.


Please, have a look at the picture!

I would be thankful for your comments!

Have a wonderful weekend!


Ivan


---
Это сообщение свободно от вирусов и вредоносного ПО благодаря защите от вирусов avast!
http://www.avast.com
Attachments
- image/jpeg attachment: DSC_0039.jpg

Received on Monday, 8 September 2014 13:21:29 UTC