- From: Hugh Glaser <hg@ecs.soton.ac.uk>
- Date: Fri, 29 Mar 2013 13:06:02 +0000
- To: Maria Maleshkova <maria.maleshkova@kit.edu>
- CC: "<public-lod@w3.org>" <public-lod@w3.org>
- Message-ID: <387E72E216DF1247A2F8ED4819C93BA74EAF91AE@UOS-MSG00041-SI.soton.ac.uk>
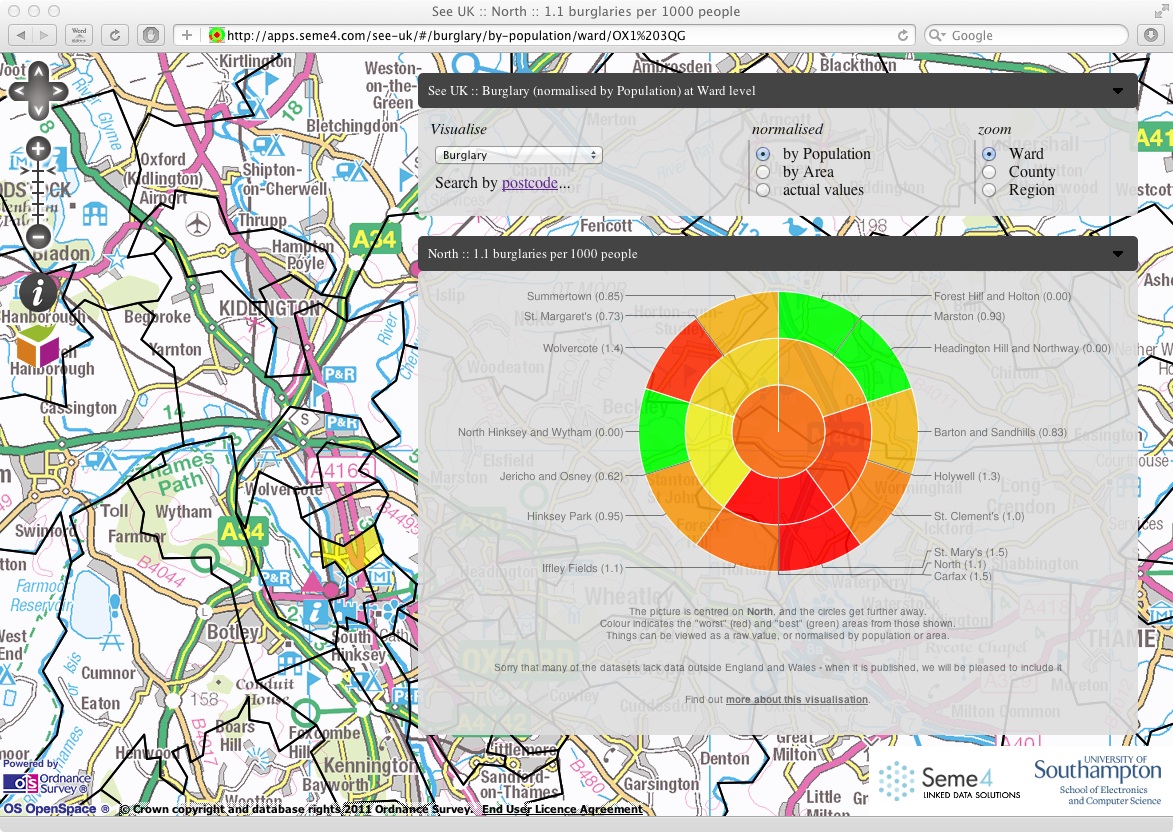
Hi. Great initiative. I see you have RKBExplorer. There is also another app over the same data at http://www.dotac.info/explorer/ We did an app over our Linked Data version of some UK public data: http://data.gov.uk/apps/see-uk Unfortunately, last week the hardware broke, so the data is offline while we get the replacement. Sigh. Screenshot attached. Best Hugh [cid:C8DA8016-8F66-4018-A7C5-1E459BB1C67A] On 27 Mar 2013, at 16:49, Maria Maleshkova <maria.maleshkova@kit.edu<mailto:maria.maleshkova@kit.edu>> wrote: Dear all, we are trying to compile a survey of topics and tools for visualizing Linked Data. This is part of the contributions of the European project EUCLID (http://www.euclid-project.eu), which aims to provide an educational curriculum for Linked Data practitioners. So far we have created training materials on introducing the Linked Data principles and application scenarios [1], and on querying Linked Data [2]. Currently we are working on covering visualization. If you are a developer or a user of methods or tools, which are relevant and we have missed, please let us know (direct reply to the email or euclid-project@sti2.org and on Twitter https://twitter.com/euclid_project). All training materials produced by EUCLID are freely available [3] (Attribution) and can be reused for trainings and educational activities. • Linked Data Visualization • Visualisation Techniques • Visualizing the Linked Data Cloud • Requirement for Visualisation Tools • Visualizing Different Data Dimensions • Existing Linked Data Visualisations • Simple bar and pie charts, histograms, line and scatterplots • Node-link tree and graph visualisations, in both 2D and 3D • Matrices, parallel co-ordinates • Timeline and topology plots, map and landscape views • Space-filling visualisations such as tree maps, rose diagrams, icicle, bubble and sunburst plots • Iconography, including star and glyph plots • Text-based • Linked Data Browsers • sig.ma, sindice, OpenLink RDF Browser, Marbles, Disco - Disco Hyperdata Browser, Piggy Bank, part of SIMILE, Zitgist DataViewer, iLOD, URI Burner • Browsers with Visualisation Options • Tabulator, IsaViz, OpenLink Data Explorer, RDF Gravity, RelFinder, DBpedia Mobile, LESS http://less.aksw.org • Further: SIMILE Exhibit, Haystack, FoaF Explorer, Humboldt, LENA, Noadster, mSpace, Revyv, RKBExplorer, Semanlink • Visualisation toolkits • Information Workbench Linked Open Data, Graves • SPARQL Visualisation Thank you for your feedback! Visit out website for further resources: http://www.euclid-project.eu Twitter: https://twitter.com/euclid_project Vimeo: https://vimeo.com/euclidproject Slideshare: https://www.slideshare.net/euclidproject LinkedIn: http://www.linkedin.com/groups/Education-Training-on-Semantic-Technologies-4917016 [1] http://www.euclid-project.eu/modules/chapter1 [2] http://www.slideshare.net/EUCLIDproject/querying-linked-data, https://vimeo.com/61618438, https://vimeo.com/61618437 [3] Attribution 3.0 Unprotected http://creativecommons.org/licenses/by/3.0/ -- Maria Maleshkova Senior Researcher Karlsruhe Institute of Technology (KIT) Phone: +49 721 608 45778 Email: maria.maleshkova@kit.edu KIT University of the State of Baden-Württemberg and National Large-scale Research Center of the Helmholtz Association
Attachments
- image/jpg attachment: see-uk-oxford.jpg
Received on Friday, 29 March 2013 13:06:48 UTC