- From: Shawn Henry <shawn@w3.org>
- Date: Thu, 30 Jan 2020 21:35:45 -0600
- To: wai-eo-editors <wai-eo-editors@w3.org>
Received on Friday, 31 January 2020 03:34:54 UTC
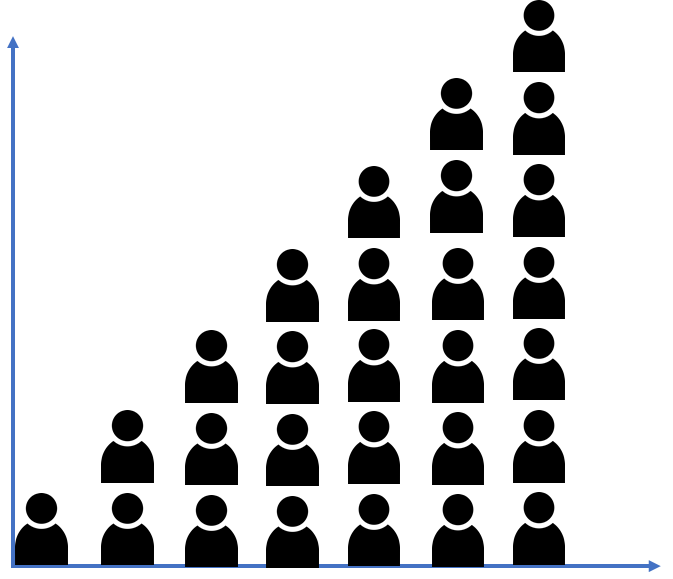
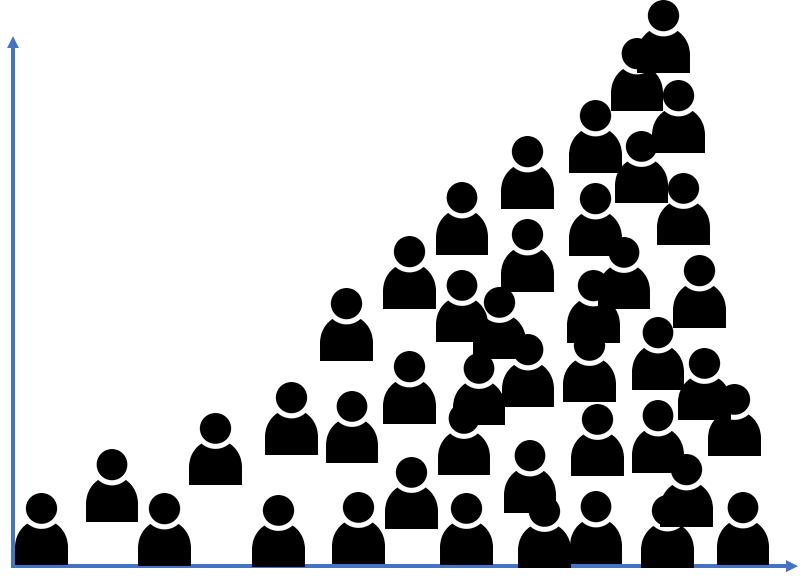
description: chart with people-icons showing just one, then a couple, then more, and more, and more.
- 6a has them neatly stacked.
- 6b has them more random and overlapping further on the chart where there are more of them.
Received on Friday, 31 January 2020 03:34:54 UTC