- From: Patrick D'Souza <pdsouza@about.com>
- Date: Wed, 07 Aug 2013 12:06:28 -0400
- To: "public-wpd-analytics@w3.org" <public-wpd-analytics@w3.org>
Received on Wednesday, 7 August 2013 16:06:55 UTC
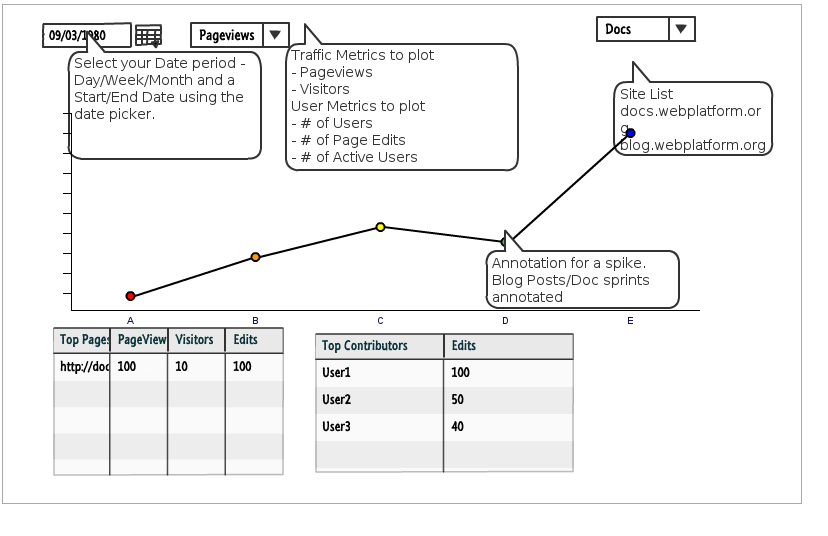
Hi All,

Here's my first pass at the wireframe for the Analytics Dashboard (Phase 1).

The top left section of the wireframe has a date picker to select the
time period(day/week/month) along with a start and end date. On
selecting a date, it should plot the time series graph and update the
datatables at the bottom with the aggregate results of the Top Pages and
Contributors. By default this dashboard will provide statistics for the
past 7 days including today. The time series graph will allow
annotations to be added to help track doc sprints, blog posts that have
contributed to traffic, users and edits.

We could possibly add some more dropdowns for segmentation by country or
referrals but I would prefer leaving segmentation to phase 2 of the
dashboard. Phase 1 should cover all high level metrics that help us
understand the progress being made on the site with respect to pages and
users.

Let me know your thoughts.

Thanks,
Patrick
Received on Wednesday, 7 August 2013 16:06:55 UTC