- From: Jonathan Chetwynd <j.chetwynd@btinternet.com>
- Date: Sun, 21 Dec 2003 11:34:09 +0000
- To: Amaya List <www-amaya@w3.org>
Received on Sunday, 21 December 2003 06:28:22 UTC
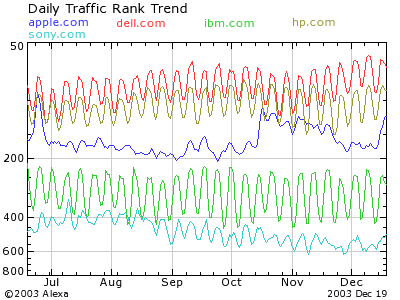
Can any statistician explain the clockwork regularity of many of these
sites' popularity?
http://traffic.alexa.com/
graph?u=apple.com&u=dell.com&u=ibm.com&u=hp.com&u=sony.com
Most appear to have a sinusoidal curve with a period of a month.
Sony's is a poor fit, and Apple's maybe stochastic.
Alexa seems to be unavailable, so i am posting the most recent results.
Perhaps they are related.....

thanks

Jonathan Chetwynd
http://www.peepo.co.uk
"A web by people with learning difficulties"
Received on Sunday, 21 December 2003 06:28:22 UTC