- From: Harry Loots <harry.loots@ieee.org>
- Date: Wed, 3 Apr 2013 10:59:03 +0200
- To: "Mattingly, F Darrell" <darrell.mattingly@uky.edu>
- Cc: WAI Interest Group <w3c-wai-ig@w3.org>, "Guettler, Karen M" <kmguet2@uky.edu>
- Message-ID: <CA++-QFc=BHZUQeaLgZoVfHEGLRz2UaD_h5Phh=Z+SLdd7FNWTg@mail.gmail.com>
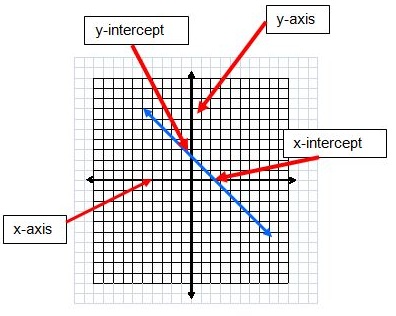
Hi Darrel
It depends on what it is that you are trying to illustrate with the image
(graph).

1) If you are trying to illustrate a simple concept (e.g. the x and
y-intercepts crosses both the y and x-axis), then a simple alt attribute
may suffice.
2) If you are explaining a more detailed concept and this is the result of
that detail then the description itself may already sufficiently describe
the image.
3) If the adjoining text does not sufficiently describe the image, then you
have two options:
a) you can use longdesc (currently not supported by all browsers), or
b) link to a separate document describing the graph.

Kind regards
Harry


On 28 March 2013 19:43, Mattingly, F Darrell <darrell.mattingly@uky.edu>wrote:

>  Hi all,****
>
> I’m working on a project to teach mathematical concepts.  What is the best
> manner to describe graphs, such as the one below****
>
> [image: File:Intercepts_Axis_Graph.JPG]<https://wiki.ncscpartners.org/mediawiki/index.php/File:Intercepts_Axis_Graph.JPG>
> ****
>
> ** **
>
> F. Darrell Mattingly, Jr.****
>
> Web Designer/Developer, ILSSA <http://www.ihdi.uky.edu/ilssa/>/NCSC<http://www.ncscpartners.org/>
> ****
>
> University of Kentucky <http://www.uky.edu/>, Human Development Institute<http://www.ihdi.uky.edu/>
> ****
>
> One Quality Street<http://maps.google.com/maps?f=q&hl=en&geocode=&q=One+Quality+Street+Lexington+KY+40507&sll=37.0625,-95.677068&sspn=37.956457,78.046875&ie=UTF8&ll=38.048159,-84.490914&spn=0.009226,0.019054&z=15&iwloc=addr&om=1>,
> Suite 729****
>
> Lexington KY  40507****
>
> ** **
>
> ** **
>
> * *
>
> Fax:****
>
> 859-323-1838****
>
> Cell:****
>
> 859-229-7499****
>
> E-mail:****
>
> darrell.mattingly@uky.edu****
>
> "Boogity, boogity, boogity-- let's go racin', boys!"
> --Darrell Waltrip****
>
> ** **
>
> ** **
>
Attachments
- image/jpeg attachment: image001.jpg
Received on Wednesday, 3 April 2013 08:59:38 UTC