- From: Henry S. Thompson <ht@inf.ed.ac.uk>
- Date: Thu, 28 Sep 2006 14:09:32 +0100
- To: public-xml-processing-model-wg@w3.org
- Message-ID: <f5bejtwrvcj.fsf@erasmus.inf.ed.ac.uk>
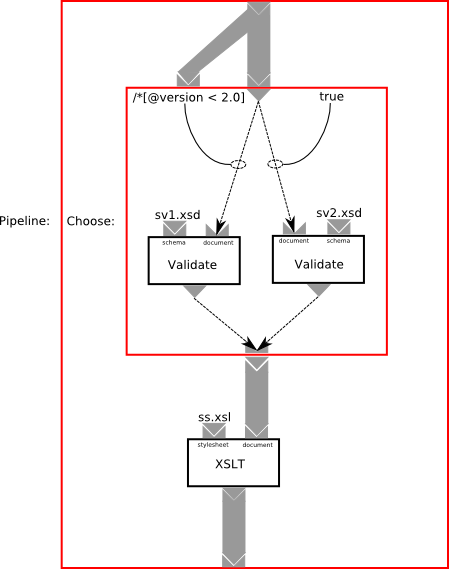
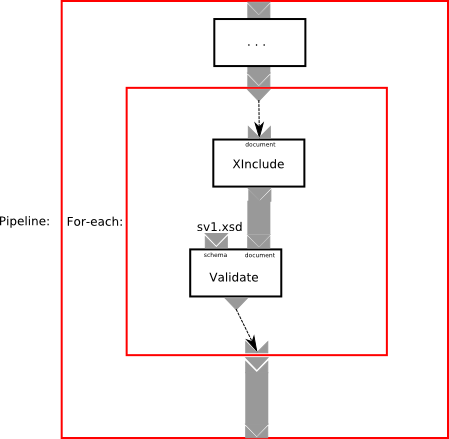
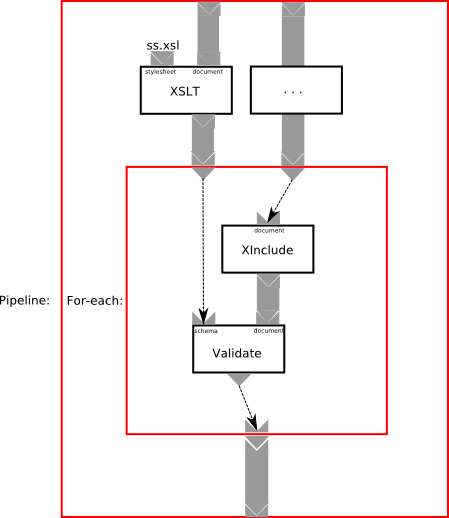
I've been thinking a lot about the graph model question, and have been
doodling in Inkscape as a way of thinking about this.

Attached find three pictures, in editable (svg) and non-editable (png)
versions.

There's a graphical reflection of my comment about the semantics of
our graphs: "Evaluation of a subpipeline evaluates every component in
it exactly once, and a document (sequence) flows down every (grey)
pipe in it exactly once".  Dotted lines are magic -- they have
different semantics depending on the kind of construct they're in.

fig2 is a careful version of Figure 2 from the WD.  The dotted lines
are contingent, that is, they may or may not see data flow.

fig1a is a simple for-each example, taking Figure 1 in the WD and
embedding it in a for-each.  Here the top dotted line iterates over
all the docs in the sequence input to the for-each, and the bottom
dotted line assembles the single outputs of each evaluation of the
XInclude/Valide subpipeline and outputs them as a document sequence on
the for-each output.

fig1b is the one I find most interesting -- the new (left hand) dotted
line _repeatedly_ flows its input to the 'schema' port of the Validate
step.  The other two are as for fig1a.

ht
--
 Henry S. Thompson, HCRC Language Technology Group, University of Edinburgh
                     Half-time member of W3C Team
    2 Buccleuch Place, Edinburgh EH8 9LW, SCOTLAND -- (44) 131 650-4440
            Fax: (44) 131 650-4587, e-mail: ht@inf.ed.ac.uk
                   URL: http://www.ltg.ed.ac.uk/~ht/
[mail really from me _always_ has this .sig -- mail without it is forged spam]
Attachments
- application/svg+xml attachment: choose pipeline, editable
- image/png attachment: fig2.png
- application/svg+xml attachment: for-each pipeline, static schema, editable
- image/png attachment: fig1a.png
- application/svg+xml attachment: for-each pipeline, computed schema, editable
- image/png attachment: fig1b.png
Received on Thursday, 28 September 2006 13:09:50 UTC