- From: Shubhie Panicker <panicker@google.com>
- Date: Fri, 5 Aug 2016 15:22:54 -0700
- To: Ben Maurer <ben.maurer@gmail.com>
- Cc: public-web-perf <public-web-perf@w3.org>, Ilya Grigorik <igrigorik@google.com>, Nat Duca <nduca@google.com>
- Message-ID: <CAK7ODi-jfhD2Ee+GjMU-zvkLhSzK0pm0=SMUrj2JS-8-gYbWqA@mail.gmail.com>
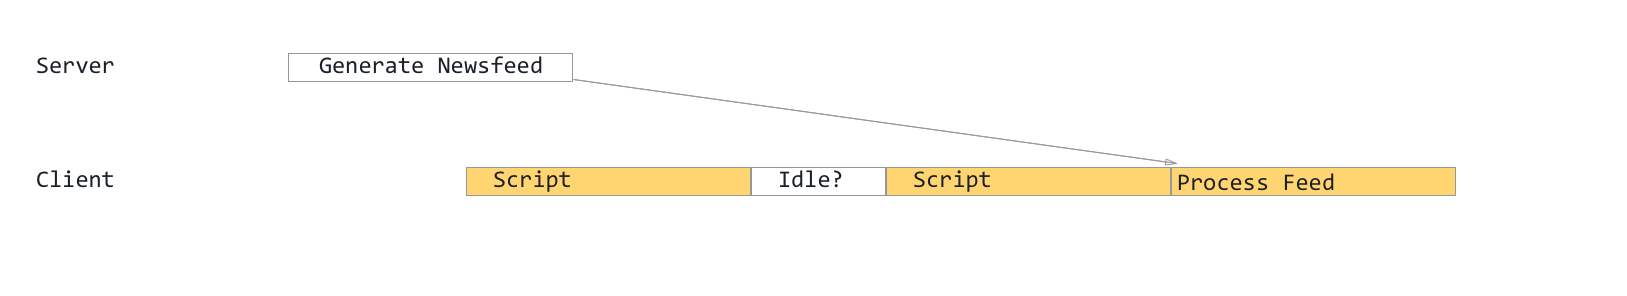
- High level:
There isn’t anything else out right now that provides insight into “main
thread busy-ness” so I can totally see where you are coming from. Rest
assured, we have other mechanisms under consideration - although it is too
early to discuss that here.
I understand you’d really like a diagnostic tool to look at main thread
business -- i.e. both long tasks as well as bursts of short tasks that
could keep the thready busy.
However this API is not intended to be that tool. It is really meant to
surface egregious issues requiring attention, guiding most developers on
where to invest their “performance budget”.
The expectation is that developers would then use tools and diagnostics to
dig in and identify and fix the root causes.

- Re: 50ms threshold
50ms is the initial default recommendation although it would be UA
specified.
I think it is worth looking into whether we could allow developers to
override the default threshold (not in V1, maybe V2+). However the minimum
granularity would depend on privacy / security considerations.

- Re: callback wrappers
As seen in the common script execution patterns
<https://docs.google.com/document/d/1UCJHjDB5ttYdDH3B9xggev10euRV3wsRR3jCoQi9AwM/edit>
- there’s a couple different frequent patterns.
For v8.run the URL is available; for direct entry into callFunction we have
the obfuscated / minified function name string -- this is similar to what
you’d see in Devtools timeline with JS Profile. (You’d deobfuscate using
your own pipeline)
>From a quick look at Devtools Js Profile on facebook -- I do see a
frequently occurring entry point for scripts - this is probably your
wrapper.
We should probably discuss your specific wrapper situation offline, as I
don't see this as a very common pattern on other top sites.

- Re: extensions
We *may* be able to indicate something generic here. Prior investigation
<https://codereview.chromium.org/1615523002/> indicates that it's very
difficult to properly account for scripts spawned by extensions.


On Fri, Aug 5, 2016 at 11:07 AM, Ben Maurer <ben.maurer@gmail.com> wrote:

> Hey,
>
> On Fri, Aug 5, 2016 at 8:41 AM, Shubhie Panicker <panicker@google.com>
> wrote:
>
>> Hey Ben,
>> Thanks for the quick response!
>>
>> 1) Re: the 50 ms threshold
>> There's couple reasons for the picking 50ms recommendation:
>> a.  > 50ms is a real risk to user responsiveness. See RAIL
>> <https://developers.google.com/web/tools/chrome-devtools/profile/evaluate-performance/rail?hl=en>
>> guideline.
>>      The API is intended as a notification of something bad that requires
>> attention.
>> b. it is safe to expose from privacy & security perspective. Fine grained
>> timing in the 10ms range opens up the attack surface.
>>    (will share more detailed doc on Privacy / Security with you if
>> interested)
>>
>> Note that high overhead of instrumentation is not one of the reasons - as
>> we do measure all tasks.
>>
>
> I think there's use cases here beyond measuring RAIL responsiveness -- for
> example, we use the 10 ms timer to try to figure out times when the event
> loop is idle so that we can infer network performance.
>
> [image: Inline image 1]
>
> In this example, the server processes newsfeed and we only receive it on
> the client after the second script has executed. If the time marked Idle is
> truly idle time we can conclude that the client didn't receive the newsfeed
> until sometime during the second script execution -- ie, that we could
> speed up the page by making the newsfeed generate faster or by making the
> contents smaller. But if the idle time is actually layout or some other
> task it may be that the client actually received newsfeed earlier, but
> wasn't able to process it. Being able to measure the time of smaller tasks
> (sub 50 ms) gives us a better picture of when the main thread is idle
>
>
>
>
>
>> 2) Great point.
>> This attribution is targeted for the V2 API i.e. pointing to the type of
>> task (script vs style / layout), and for the case of scripts including the
>> culprit URL
>> So it will come just not in V1 :)
>>
>
> How hard is this to add for v1?
>
We are looking into it :)


>
>
>> Please take a look at the writeup
>> <https://docs.google.com/document/d/1J0brr10eHRpk0F6tRaWzkgI3mHja3SOHR6fwHBGzGs0/edit> mentioning
>> script URL attribution, if you haven't already.
>>
>
> I think fb might actually defeat the work done in script url attribution.
> Often times our callbacks are wrapped (eg, we have an internal api
> Event.listen which installs an event listener and adds a wrapper around it
> for measurement purposes). So the vast majority of events would probably
> blame to the file that has the abstraction. What would be helpful here is
> if we could annotate function objects with a name (Function.__profilingName
> = "...")
>
> One other thought re: attribution -- how are extensions handled? Would it
> be possible to have a source that tells us an extension is responsible
> (even if you can't identify which?)
>
>
> 3) "long task" events from early in the lifecycle of the page -- way
>> before any scripts -- are typically not a risk to user responsiveness.
>> And there isn't a compelling reason to worry about long tasks during that
>> time AFAIK
>> So I'm not sure it's worth buffering and delivering those.
>>
>
> Yes, but I think that this api is (or should be) more than about just
> responsiveness -- it's the web developers only insight into the usage of
> the main thread. We've found that there are often gaps early in the page
> that are difficult to explain and having something that says "the main
> thread was busy" would help us better annotate/investigate this time.
>
> -b
>
Attachments
- image/png attachment: image.png
Received on Friday, 5 August 2016 22:29:51 UTC